How many jobs to apply to a week is the question every job seeker types into a search box around the second week of a search. The standard answer is "ten to fifteen, two or three a day," and it is repeated on career blogs with no study behind it. This guide looks at what public data does show, what it cannot tell you, and how to turn it into a weekly number you can actually keep up.

Key takeaways
- The one nationally representative US survey that measured applications, interviews and offers together found about six applications per interview, and the highest offer rate in the 21–80 applications band over two months.
- That is roughly two to nine applications a week, not the ten to fifteen most advice prescribes. It is survey data from 2018, so treat it as a direction, not a target.
- Employers now see more applications per job than a few years ago, so a generic application is easier to lose.
- Set your number from your own interview rate, and spend the saved time on tailoring and follow-up.
Where "two to three a day" comes from
Search for the number and you will find the same range repeated: two to three applications a day, ten to fifteen a week. It is reasonable-sounding, and it is easy to remember, which is why it spreads. What is hard to find is a source. Most of the pages that quote it do not link to a survey or a dataset that measured how many applications led to interviews or offers.
That does not make the range wrong. It means you should not treat it as a rule. There is public data on the question, and it points to a more modest pace.
What the US government data measured
In 2018 the U.S. Bureau of Labor Statistics added job-search questions to the Current Population Survey, the monthly survey of about 60,000 households behind the national unemployment rate. Two BLS economists, Michael Dalton and Jeffrey Groen, published the results in "How do jobseekers search for jobs?" (Beyond the Numbers, November 2020). The sample is people who were unemployed at the time and had looked for work in the previous four weeks.
The survey asked how many jobs people applied for in the last two months and how many of those led to an interview. The averages were 13.67 applications and 1.93 interviews, which the authors summarize as about six applications for one interview. Spread over two months, that average is under two applications a week.
The table that matters most relates the number of applications to the chance of having received a job offer. The weekly pace column is my own arithmetic (two months is about 8.7 weeks), not a BLS figure.
| Applications in two months | Roughly per week | Received a job offer |
|---|---|---|
| 0 | 0 | 13.21% |
| 1 to 10 | about 1 | 27.20% |
| 11 to 20 | 1 to 2 | 29.48% |
| 21 to 80 | about 2 to 9 | 30.89% |
| 81 or more | 9 or more | 20.36% |
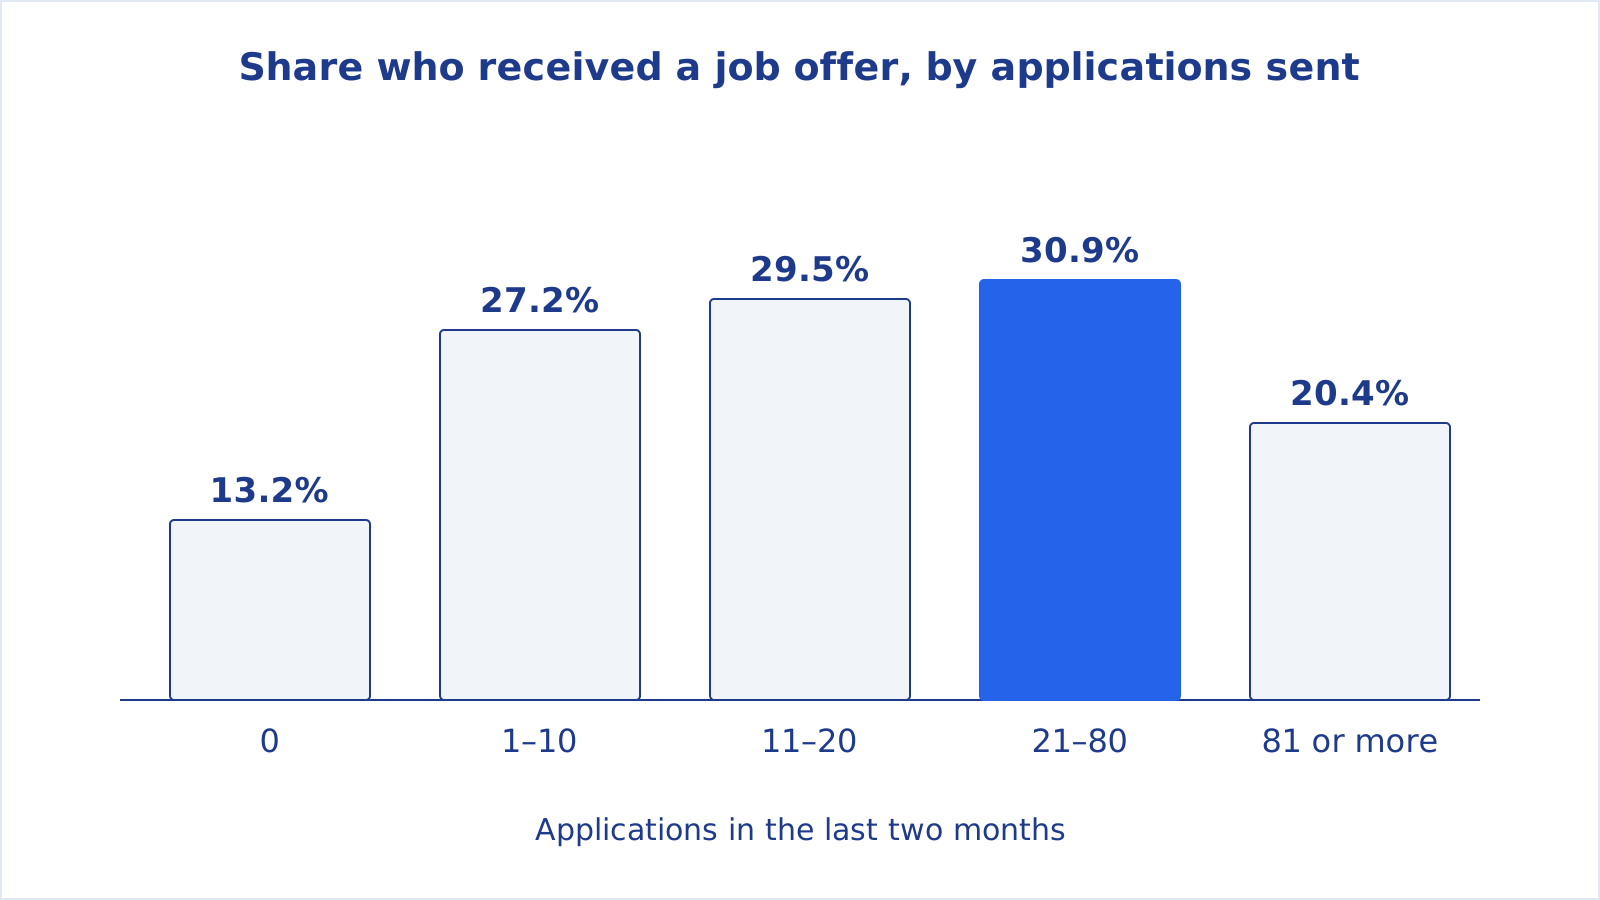
The curve rises, then falls. BLS notes that among people who sent up to 80 applications, more applications went with a higher chance of an offer, but the group that applied to 81 or more was less likely to have received one than the 21–80 group.
How to read the numbers without overreading them
Be careful with this table. Four limits matter:
- It is a correlation, not an experiment. Nobody was assigned to send 30 or 300 applications.
- The sample is unemployed jobseekers in 2018. It says nothing about people searching while employed, or about today's market.
- Offers are counted "since they last worked," so the offer figures are not tied only to the last two months of applications.
- BLS gives two possible explanations for the drop at 81 or more: people who apply widely may believe their odds are lower, or they may be more urgent and therefore less targeted. Both are about the person, not proof that the applications themselves hurt.
What the data does support is narrower and more useful: more applications was not a reliable path to more offers past a point, and the people with at least one interview had a much higher chance of an offer (about 37%, against about 10% for those with none, as BLS reports). Interviews, not submissions, are the number that moves the outcome.
Other sources quote different numbers. Treat any figure that does not say who was asked, when and how with caution. This post uses only figures we could trace to a named source.
Why volume alone is harder today
Employers receive far more applications than they did. Greenhouse, a hiring platform, reports in its 2026 hiring benchmarks that applications per job rose from 116 in 2022 to 244 in 2025, up 111%. That figure comes from its own customers' data, so it describes companies that use Greenhouse, not every employer.
For you, the practical point is simple: when each posting draws that many applications, an application that reads like a template has little to separate it. That is a reason to put time into the roles where you have a real case, and it is the same reason resume tailoring pays off. Our guide to tailoring your resume to a job description covers that step by step.
Set your weekly number from your own data
Instead of copying a range, measure your own funnel for two weeks. You need three numbers: applications sent, replies that lead to an interview, and the time each application took.
- Track every application. A spreadsheet works. So does an application tracker with statuses from Draft to Interviewing.
- Calculate your interview rate. Interviews divided by applications. BLS found about one interview per six applications on average, but your rate depends on your field, level and location.
- Compare two groups. Applications where you matched most must-haves and rewrote the top of your resume, and applications where you did not. If the first group converts better, you have your answer for where to spend time.
- Pick the number you can do well. If a good application takes 20 minutes and you have five hours a week, the ceiling is about 15. If you have two, it is about six. A number you cannot sustain is not a plan.

A fit-first weekly routine
Here is one routine that puts fit ahead of volume. Adjust the numbers to your hours.
- Monday, 30 minutes: build the shortlist. Pull the new postings, rank them by how well they match your resume, and keep the top ten. Drop anything that fails a hard requirement you cannot meet.
- Tuesday to Thursday, about an hour a day: apply. Tailor the summary and the top bullets, check the keywords from the posting that are true for you, write a short cover letter if the posting asks for one, and send. Two or three well-built applications a day is enough.
- Friday, 30 minutes: follow up and review. Update statuses, note which applications got replies, and prepare for any interview. Practice answers to the questions you tend to stumble on; our guide to the STAR method helps with behavioral ones.
This works out to roughly five to eight applications a week with real tailoring, which sits inside the 21–80 band over two months. It is a suggestion built on that evidence, not a guarantee of any result.
Where CareerUpAgent fits
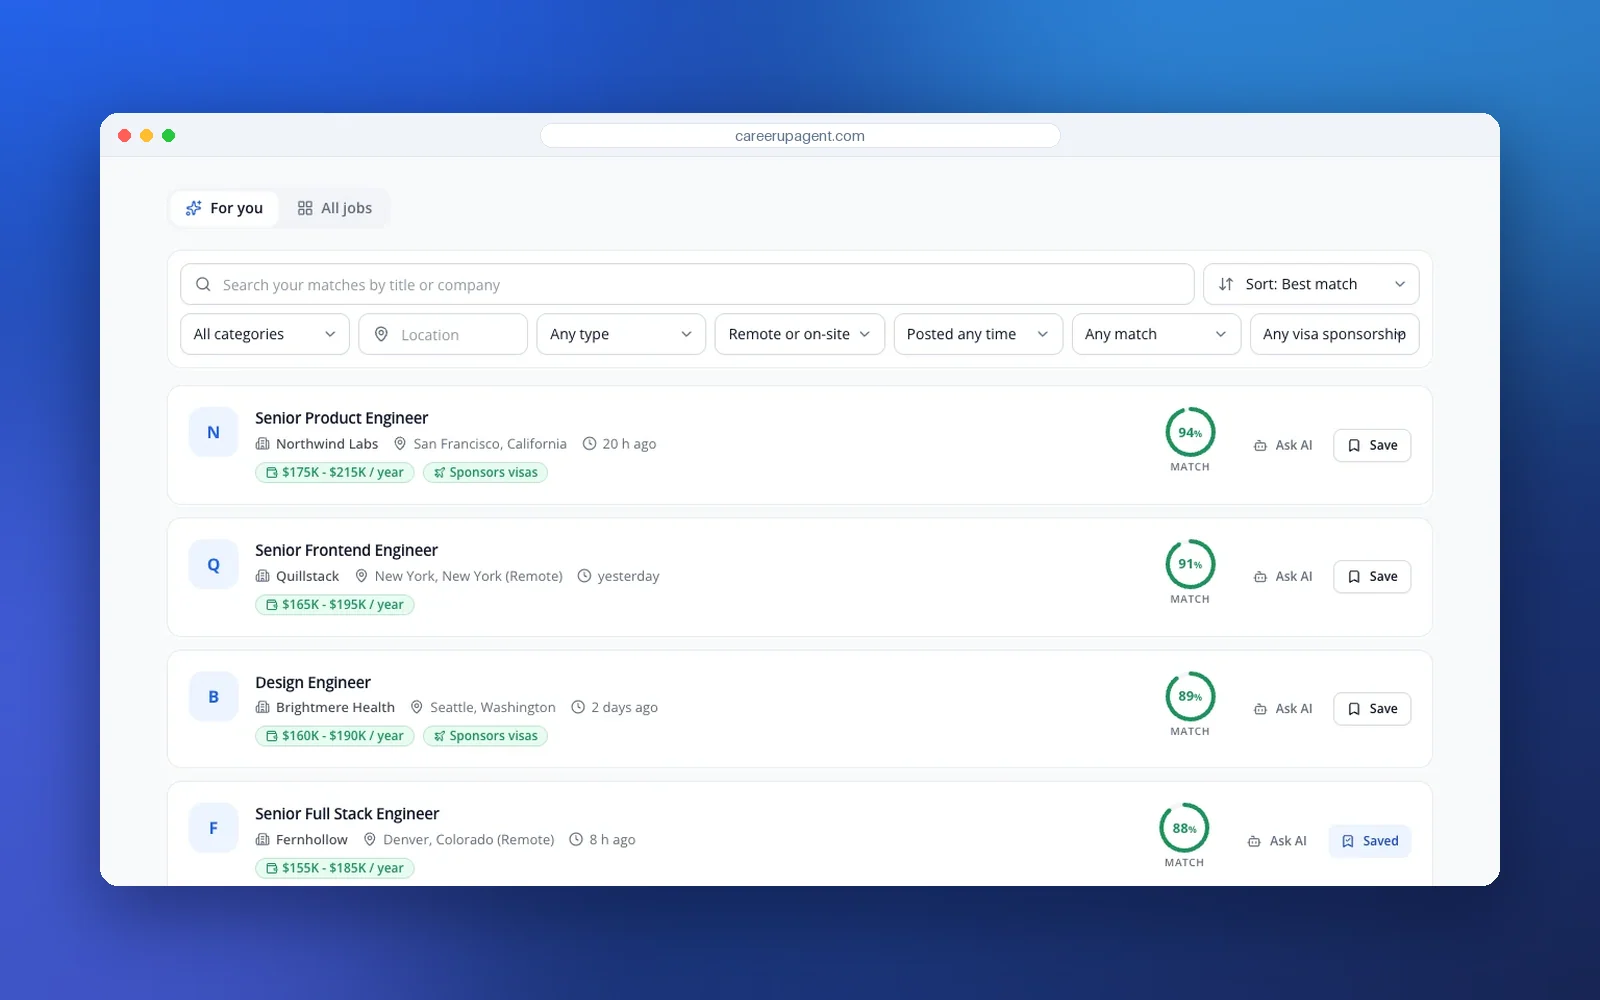
The Monday shortlist is where most people lose time, so that is the step we built around. In CareerUpAgent, jobs are ranked by a match score against your resume, with salary, location and visa-sponsorship badges visible in the list, so you can see the strong fits first.
- Job alerts tell you when a new job matches at least 80% and send a daily email digest, so the shortlist builds itself.
- Tailored resume and cover letter drafts are written for each application and open in an editor, where you change whatever you want.
- The Agent prepares application drafts for your best new matches each morning. You review and send each one yourself, so nothing goes out without you.
- The application tracker shows your pipeline by status, which is how you calculate your own interview rate.
If you want to see how one resume fits one posting before you decide to apply, the free resume-to-job match checker works without signing up. For the summary at the top of the resume, see our resume summary examples.
Tip: Put a hard stop on the week. Once your tailored applications are sent, stop. Extra hours are better spent on interview practice or a message to someone who works at a company on your list than on a fifteenth form.
The short version
There is no magic count. The best public evidence we found says that sending a moderate number of applications was associated with more offers than sending very few, and that sending a very large number was not better. Today's higher application volumes at employers make a tailored application worth more, not less. Measure your own interview rate, choose a number you can do well, and let fit decide where the hours go.
Ready to build the shortlist faster? Create a free CareerUpAgent account and see your matches ranked by fit.